


.png)


.png)

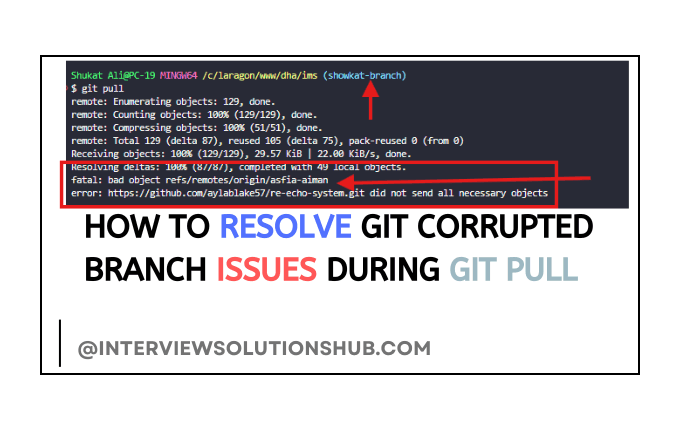
Laravel 11 Cron Job Task Scheduling with Example
Read More

.png)
Cryptocurrencies are notorious for their volatility, but with the right tools, you can spot trends and react with confidence. This article explains how our Python-based crypto forecasting tool analyzes candlestick patterns and technical indicators like RSI and Momentum to predict the next price movement — for any cryptocurrency, whether it's Ethereum (ETH), Solana (SOL), or even emerging altcoins.
This tool gives hourly predictions based on 7 days of historical market data from Yahoo Finance.
Using yfinance, the script pulls OHLCV data for any coin pair like:
ETH-USD
SOL-USD
XRP-USD
We calculate:
RSI (Relative Strength Index): Measures overbought/oversold strength.
Momentum (Rate of Change): Detects velocity and direction of price movement.
ATR (Average True Range): Estimates market volatility.
Our model checks for:
Bullish Signals: Close > Open, RSI < 30, Momentum > 0
Bearish Signals: Close < Open, RSI > 70, Momentum < 0
Neutral: No strong signal detected
We use the ATR to predict the high and low of the next candlestick, helping traders plan entry and exit zones.
Using mplfinance, the last 60 candles are plotted with:
Real-time support & resistance levels
Volume
Visual overlays

import yfinance as yf
import pandas as pd
import ta
import mplfinance as mpf
from datetime import datetime

def predict_next_candle():
    ticker = "BTC-USD"        // change the coin (ETH-USD , TRB-USD , SOL-USD)
    interval = "1h"
    lookback = "7d"

    print(f"Fetching data for {ticker}...")

    # Download data
    df = yf.download(ticker, interval=interval, period=lookback, auto_adjust=False)

    # 🔧 Fix MultiIndex column issue
    if isinstance(df.columns[0], tuple):
        df.columns = [col[0] for col in df.columns]

    print("Cleaned Columns:", df.columns.tolist())

    # Drop rows with missing required data
    required_cols = ['Open', 'High', 'Low', 'Close', 'Volume']
    df.dropna(subset=required_cols, inplace=True)

    # Add technical indicators
    df['RSI'] = ta.momentum.RSIIndicator(close=df['Close']).rsi()
    df['Momentum'] = ta.momentum.ROCIndicator(close=df['Close']).roc()

    # Drop rows with NaNs created by indicators
    df.dropna(inplace=True)

    # Get last row for prediction
    last = df.iloc[-1]
    is_bull = (last['Close'] > last['Open'] and last['RSI'] < 30 and last['Momentum'] > 0)
    is_bear = (last['Close'] < last['Open'] and last['RSI'] > 70 and last['Momentum'] < 0)

    if is_bull:
        prediction = "📈 Prediction: Next candle is likely Bullish"
    elif is_bear:
        prediction = "📉 Prediction: Next candle is likely Bearish"
    else:
        prediction = "❓ Prediction: Neutral / Sideways"

    # Estimate ATR (volatility) and next candle price range
    df['HL'] = df['High'] - df['Low']
    atr_period = 14
    atr = df['HL'].rolling(window=atr_period).mean().iloc[-1]
    predicted_low = last['Close'] - atr
    predicted_high = last['Close'] + atr

    # Support & Resistance
    recent_data = df.tail(60)
    support = recent_data['Low'].min()
    resistance = recent_data['High'].max()

    # Print enhanced prediction
    print("\n📊 Prediction Summary")
    print(f"🕒 Time: {datetime.now()}")
    print(f"{prediction}")
    print(f"📉 Support: {support:.2f}")
    print(f"📈 Resistance: {resistance:.2f}")
    print(f"\n📍 Predicted Next Candle Range:")
    print(f"→ From: {predicted_low:.2f}")
    print(f"→ To:   {predicted_high:.2f}")
    print(f"↔ Expected Volatility (ATR): {atr:.2f}")
    print(f"\n🕯️ Last Candle Info:")
    print(f"Open:     {last['Open']:.2f}")
    print(f"High:     {last['High']:.2f}")
    print(f"Low:      {last['Low']:.2f}")
    print(f"Close:    {last['Close']:.2f}")
    print(f"RSI:      {last['RSI']:.2f}")
    print(f"Momentum: {last['Momentum']:.2f}")

    # Plot candlestick chart with support/resistance lines
    apds = [
        mpf.make_addplot([support] * len(recent_data), color='green', linestyle='--'),
        mpf.make_addplot([resistance] * len(recent_data), color='red', linestyle='--')
    ]

    mpf.plot(
        recent_data,
        type='candle',
        style='yahoo',
        title=f'{ticker} - Last 60 Candles',
        ylabel='Price ($)',
        volume=True,
        addplot=apds
    )

    # Save to file
    with open("prediction.txt", "w", encoding="utf-8") as f:
        f.write("📊 Prediction Summary\n")
        f.write(f"🕒 Time: {datetime.now()}\n")
        f.write(f"{prediction}\n")
        f.write(f"Support: {support:.2f}\n")
        f.write(f"Resistance: {resistance:.2f}\n")
        f.write(f"\nPredicted Next Candle Range:\n")
        f.write(f"→ From: {predicted_low:.2f}\n")
        f.write(f"→ To:   {predicted_high:.2f}\n")
        f.write(f"Volatility (ATR): {atr:.2f}\n")
        f.write(f"\nLast Candle Info:\n")
        f.write(f"Open:     {last['Open']:.2f}\n")
        f.write(f"High:     {last['High']:.2f}\n")
        f.write(f"Low:      {last['Low']:.2f}\n")
        f.write(f"Close:    {last['Close']:.2f}\n")
        f.write(f"RSI:      {last['RSI']:.2f}\n")
        f.write(f"Momentum: {last['Momentum']:.2f}\n")

    print("\n✅ Prediction saved to 'prediction.txt'")

if __name__ == "__main__":
    predict_next_candle()
📊 Prediction Summary
🕒 Time: 2025-07-25 11:20:41.872191
❓ Prediction: Neutral / Sideways
📉 Support: 115168.35
📈 Resistance: 120265.52

📍 Predicted Next Candle Range:
→ From: 114987.43
→ To:   116227.28
↔ Expected Volatility (ATR): 619.92

🕯️ Last Candle Info:
Open:     115607.35
High:     116155.85
Low:      115364.42
Close:    115607.35
RSI:      23.58
Momentum: -193.28

✅ Prediction saved to 'prediction.txt'
And the tool generates a full candlestick chart in a window.
✅ Short-Term Trading Decisions
📉 Risk Management via Support/Resistance
📊 Visual Backtesting with Historical Trends
Here’s how you can customize the asset being analyzed:
In your script, change this line:
ticker = "ETH-USD" # or SOL-USD, ADA-USD, etc.

Greetings, I'm a passionate full-stack developer and entrepreneur. I specialize in PHP, Laravel, React.js, Node.js, JavaScript, and Python. I own interviewsolutionshub.com, where I share tech tutorials, tips, and interview questions. I'm a firm believer in hard work and consistency. Welcome to interviewsolutionshub.com, your source for tech insights and career guidance.
Recent posts form our Blog

.png)


.png)
0 Comments
Like 0